A practical dive into XGBoost and CatBoost hyperparameter tuning using HyperOpt

Learn how we test the qualitative performance of XGBoost and CatBoost hyperparameter tuning with HyperOpt to improve our ML model prediction process.

Jakub Karczewski

Machine Learning Engineer
Vector

16 December 2019

Group

6 min read

One of the key responsibilities of the Data Science team at Nethone is to improve the performance of machine learning (ML) models of our anti-fraud solution, both in terms of their prediction quality and speed. To help us with this process, we must look at XGBoost and CatBoost hyperparameter tuning - but what is it?

XGBoost and CatBoost hyperparameter tuning

One of the challenges we often encounter is a large number of features available per observation - surprisingly, not the lack of them. We have a ton of information provided by our profiling solution (e.g. behavioral data, device and network information), transaction data provided by the client (what was bought, payment details, etc.) and data from additional external APIs - in total a couple of thousand features, even before we perform feature engineering.

For each transaction, we have to put client-provided data through hundreds - or in some cases even thousands - of feature engineering pipelines. At the same time, we have to get supplementary data from our profiling script and various internal and external APIs. In the next step, we have to perform predictions by multiple models. All of that has to be done in real-time, otherwise, customer conversion will suffer due to cart abandonment.

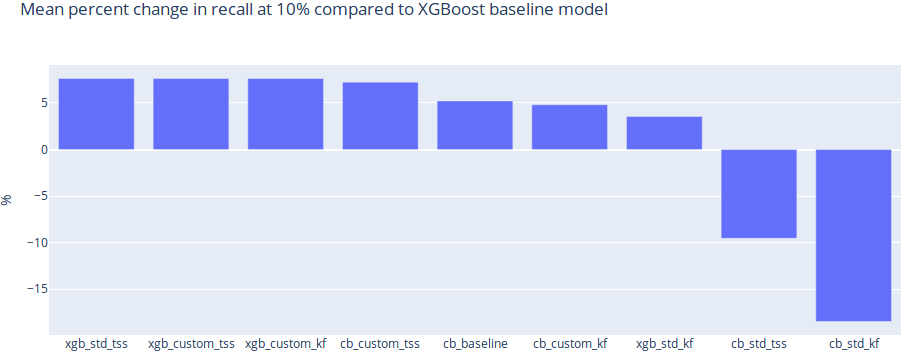
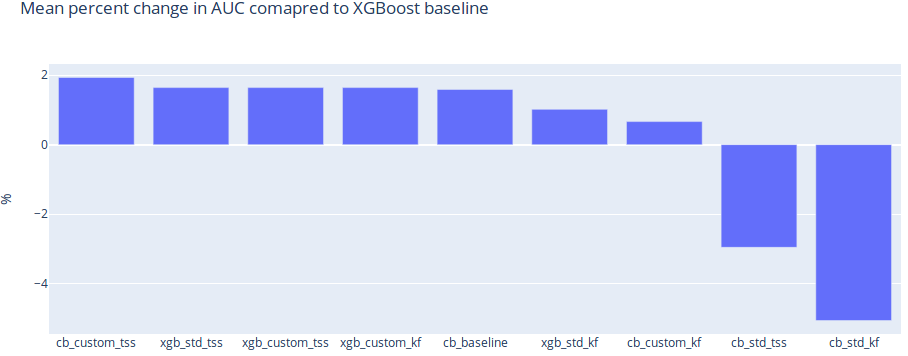
We wanted to test the qualitative performance of various XGBoost and CatBoost models, to see which one will better suit our needs. In this particular case, we are going to take a closer look at the last step of that process  - prediction. Namely, we are going to use HyperOpt to tune the hyperparameters of models built using XGBoost and CatBoost. Having as few false positives as possible is crucial in the business of fraud prevention, as each wrongly blocked transaction (false positive) is a lost customer. Therefore, in this analysis, we will measure the qualitative performance of each model by taking a look at recall measured at a low percentage of traffic rejected.

Justification for comparing CatBoost and XGBoost

Unlike XGBoost, CatBoost deals with categorical variables in their native form. While using XGBoost, we have to make a choice on how to handle categoricals (binarization or encoding). There is no straightforward answer for choosing binarization vs encoding. This decision should be made ideally on a per-categorical feature basis. We usually get the best quality-to-speed ratio by encoding the categorical columns. Therefore, for this experiment, all categorical columns for XGBoost were hashed with murmur32.

Model-agnostic HyperOpt objective

Since we want to compare two algorithms, we need to have a clear way for them to be used by HyperOpt. As in the future, we might want to compare more packages, the class shown below was designed to work with any other package implementing scikit-learn compliant API.

Implementing custom metric in Scikit-Learn

As mentioned, we pay extra scrutiny to the recall of our models at a low percentage of affected traffic. Therefore, we will run experiments where we provide this metric as an objective to HyperOpt. To do that, first, we have to implement said metric. It will accept three parameters: labels, predictions (predicted probe, not predicted label) and the threshold defined as a percentage of traffic affected.

Briefly, the code above creates a list of pairs of true_label and predicted probability. Then, this list is sorted in descending order of probability. Finally, first n percent of data is kept (defined by threshold parameter) and recall is calculated on that slice.

To have that metric available during cross-validation, we have to pass it to scikit-learns’ make_scorer function.

Since recall at the threshold requires a probability instead of predicted class for each observation, we have to set needs_proba to True. Also, since this is a score, not a loss function, we have to set greater_is_better to True otherwise the result would have its sign flipped.

A word of warning about optimizing XGBoost parameters

XGBoost is strict about its integer parameters, such as n_trees, depth etc. Therefore, be careful when choosing HyperOpt stochastic expressions for them, as quantized expressions return float values, even when their step is set to 1. Save yourself some debugging by wrapping stochastic expressions for those parameters in a hyperopt.pyll.scope.int() function call.

Model evaluation

We’ve built the following models on two confidential datasets:

  • Baseline CatBoost (categorical features indices passed to fit) and baseline XGBoost (encoded categorical features)
  • Optimized CatBoost without custom metric
  • Optimized XGBoost without custom metric
  • Optimized CatBoost with custom metric
  • Optimized XGBoost with custom metric

In the case of optimized models, we’ve decided to test standard KFold (KF) or time series split (TSS) CV. Experiments with TSS CV were justified by time-series-like properties that we have noticed in the datasets chosen for those experiments.

In the case of our smaller dataset we’ve run HyperOpt for 50 iterations, and for the larger dataset HyperOpt was run for 25 iterations.

Performance is shown as a percentage difference in a given metric between the given model and the baseline XGBoost model.

mean-percent-change-recall-compared-to-xgboost-baseline-model

In terms of recall at 10% of affected samples, three models achieved best results:

  • XGBoost with standard objective and TSS CV
  • XGBoost with custom objective and TSS CV
  • XGBoost with custom objective and KF CV

CatBoost model with a custom objective and TSS CV came in very close in this metric and was best in terms of achieved AUC.

Interestingly baseline CatBoost model performed almost as well as the best optimized CatBoost and XGBoost models. This is in line with its author's claim that it provides great results without parameter tuning.

mean-percent-change-auc-compared-to-xgboost-baseline

As always, remember that there is no free lunch. We have provided the code, so you can repeat those experiments on your own datasets. Let us know in the comments what worked best for you!

Ready to detect fraud just like Azul?

Ready to detect fraud just like Azul?

Start measuring fraud attacks today and find out if there are bots attacking your site. Arrange a call to discuss a tailored solution or explore our platform for free.

Book a call